IDSS contains service information for the engine selected. Navigate through the Table of Contents (TOC) by clicking on titles to find information you would like to view. When a title in the TOC is selected, the associated information will display on the right side. Scroll down to view all text and graphics for the title selected.
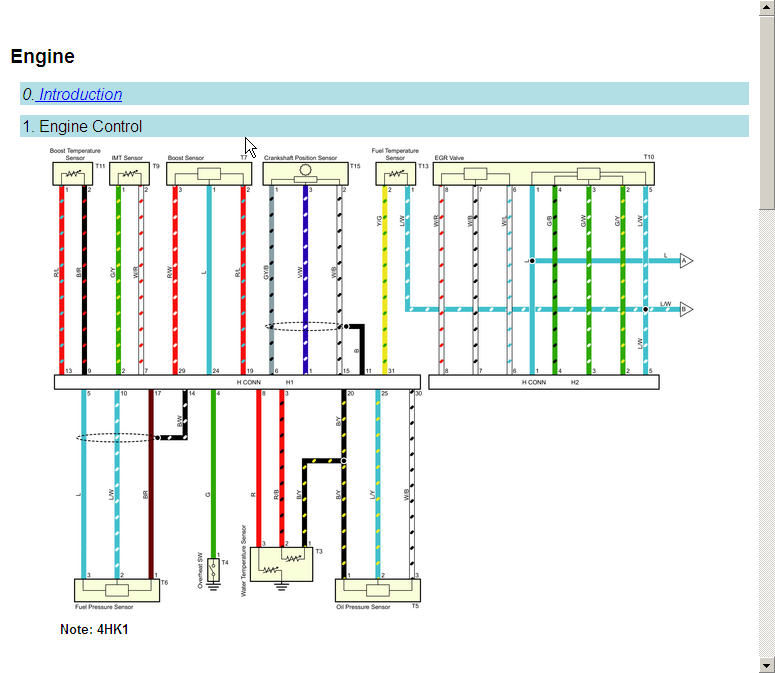
IDSS contains electrical schematics/ETM for the engine selected. Navigate through the Table of Contents (TOC) by clicking on titles to find information you would like to view. When a title in the TOC is selected, the associated information will display on the right side. Scroll down to view all text and graphics for the title selected.
The Schematics section lists all schematics for the engine.
Click on the image displayed to open it in an image viewer. When the image viewer opens it has a toolbar at the top.
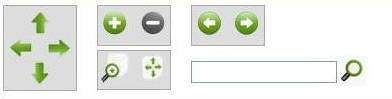
The toolbar allows the user to select desired actions or functions from within the viewer.
The toolbar buttons that are used in the image viewer are as follows:
NAVIGATION Use to move to the area of the illustration to be viewed |
|
|
ZOOM Used to Zoom in/Zoom out on the viewer image |
|
|
MAGNIFIER / FIT TO PAGE Magnifier is a window that magnifies the image only within the magnifier window Fit to Page formats the image into a single page frame size for viewing or printing |
|
|
PREVIOUS/NEXT FRAME Moves to the previous or next frame in the direction selected |
|
 |
SEARCH Used to searches for and highlight text |
|
|
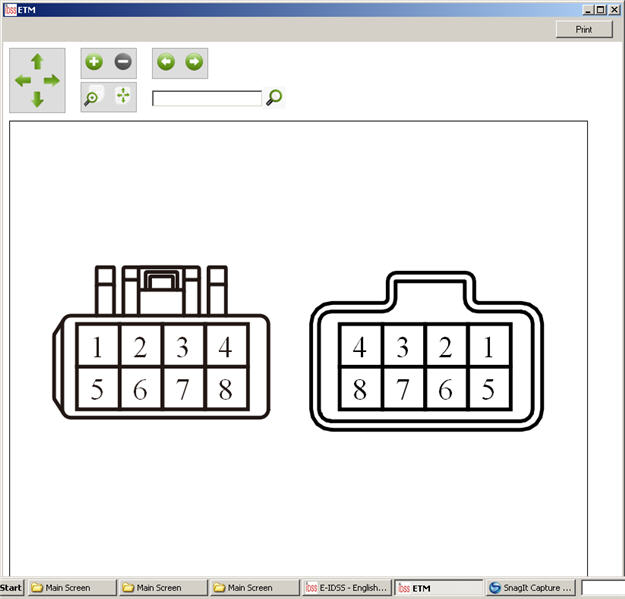
There are linked areas within the ETM image viewer that, when selected, will open a window with information pertaining to that area of the ETM.
This function is primarily available for component and connector views.
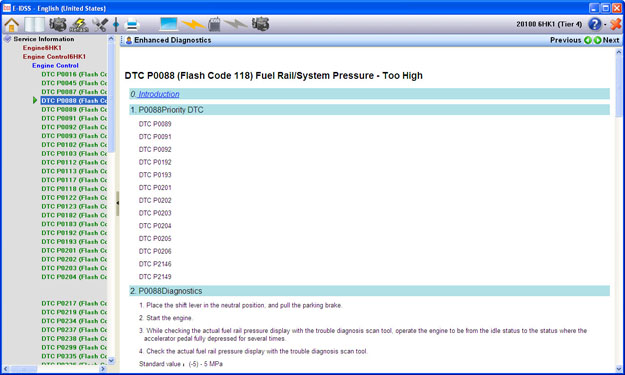
The Enhanced Diagnostics function allows you to view "live" values of parameters mentioned in the diagnostic charts of the service manual. If Enhanced Diagnostics capability is available for the diagnostic chart you are viewing, an "Enhanced Diagnostics" icon will be present at the top left corner of the service information toolbar. In Enhanced Diagnostics, during diagnostics, it is possible to display a data parameter which is related to the DTC. For Enhanced Diagnostic DTCs, the “Enhanced Diagnostics” icon will be displayed in the upper left of the service tool bar.
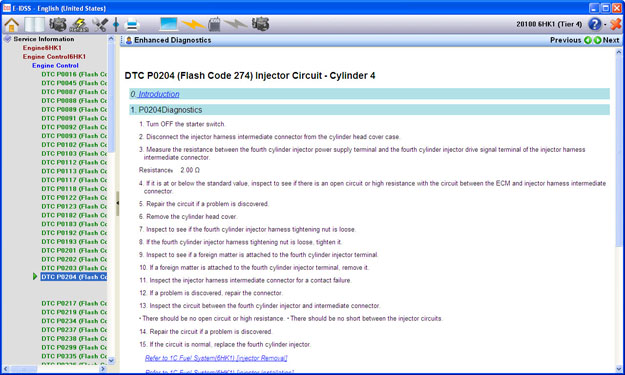
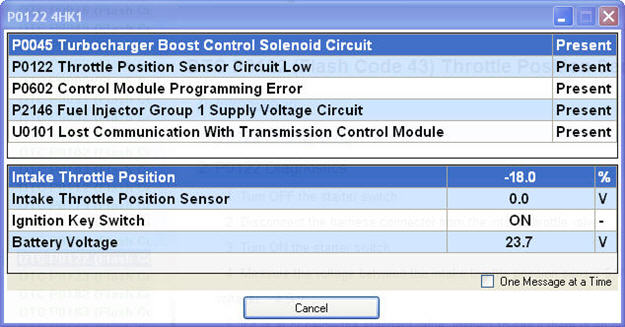
When you click the "Enhanced Diagnostics" icon, a new window will open. This window will display "live" values from the engine for all parameters discussed in the diagnostic chart. This window will also display DTC status for the ECM diagnosed by that chart.
NOTE: You must be connected to the machine to view Enhanced Diagnostics live data. If you are not connected to the machine when you click the "Enhanced Diagnostics" link, or if you lose your connection to the machine while viewing Enhanced Diagnostics, IDSS will inform you to correct your connection to the engine and/or IDSS interface device.
If you are not connected to the machine, you can still view service information without the Enhanced Diagnostics live data.
